East Surrey (circonscription du Parlement britannique)
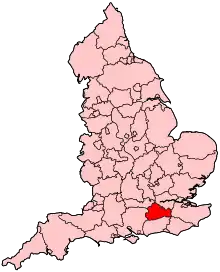
La circonscription d'East Surrey est une circonscription parlementaire britannique située dans le Surrey.
Circonscription parlementaire de la Chambre des Communes

| Comté | Surrey |
|---|---|
| Électeurs inscrits | 77,145 (Décembre 2010) |
| Villes principales | Caterham, Whyteleafe, Warlingham, Lingfield, Woldingham, Godstone, Horley, Oxted, Limpsfield, Tatsfield |
| Création | 1918 |
|---|---|
| Member of Parliament |
Claire Coutinho (Conservateur) |
| Créé à partir de |
Reigate (Surrey S.E.) Wimbledon (Surrey N.E.) |
| Parlement européen | Angleterre du Sud-Est |
|---|
Une première circonscription d'East Surrey existe de 1832 à 1885. La circonscription actuelle a été créée en 1918 et est représentée à la Chambre des communes du Parlement britannique. Elle est représente depuis 2019 par Claire Coutinho du Parti conservateur.
Members of Parliament
MPs 1832–1885
| Élection | Premier membre[1] | 1er Parti[2] | Second membre[1] | 2e Parti[2] | ||||
|---|---|---|---|---|---|---|---|---|
| 1832 | John Ivatt Briscoe | Whig[3],[4],[5],[6],[7] | Aubrey Beauclerk | Radical[8],[9],[10] | ||||
| 1835 | Richard Alsager | Conservateur[3] | ||||||
| 1837 | Henry Kemble | Conservateur[3] | ||||||
| Élection partielle 1841 | Edmund Antrobus | Conservateur[3] | ||||||
| 1847 | Peter Locke King | %252C_by_John_%2526_Charles_Watkins.jpg.webp) |
Whig[11],[12] | Thomas Alcock | Whig[11],[12] | |||
| 1859 | Libéral | Liberal | ||||||
| 1865 | Charles Buxton | Libéral | ||||||
| 1871 | James Watney | .jpg.webp) |
Conservateur | |||||
| 1874 | William Grantham |  |
Conservateur | |||||
| 1885 | Suppression de la circonscription | |||||||
MPs depuis 1918
| Élection | Membre[13] | Parti | |||
|---|---|---|---|---|---|
| Circonscription recréée | |||||
| 1918 | Sir Stuart Coats, Bt | Conservateur | |||
| 1922 | James Galbraith | Conservateur | |||
| 1935 | Charles Emmott | Conservateur | |||
| 1945 | Michael Astor | Conservateur | |||
| 1951 | Charles Doughty | Conservateur | |||
| 1970 | William Clark | Conservateur | |||
| Fev 1974[14] | Geoffrey Howe | .tif.png.webp) |
Conservateur | ||
| 1992 | Peter Ainsworth | Conservateur | |||
| 2010 | Sam Gyimah |  |
Conservateur | ||
| 2019 | Libéral Démocrates | ||||
| 2019 | Claire Coutinho |  |
Conservateur | ||
Élections
Élections dans les années 2010
| Parti | Candidat | Votes | % | ± | |
|---|---|---|---|---|---|
| Conservateur | Claire Coutinho | 35,624 | 59.7 | ||
| Libéral Démocrate | Alexander Ehmann | 11,584 | 19.4 | ||
| Travailliste | Frances Rehal | 8,247 | 13.8 | ||
| Green | Joseph Booton | 2,340 | 3.9 | ||
| Indépendant | Helena Windsor | 1,374 | 2.3 | N/A | |
| Monster Raving Loony | Martin Hogbin | 521 | 0.9 | N/A | |
| Majorité | 24,040 | 40.3 | |||
| Participation | 59,925 | 72.1 | |||
| Conservateur hold | Swing | ||||
| Parti | Candidat | Votes | % | ± | |
|---|---|---|---|---|---|
| Conservateur | Sam Gyimah | 35,310 | 59.6 | +2.2 | |
| Travailliste | Hitesh Tailor | 11,396 | 19.2 | +7.4 | |
| Libéral Démocrate | David Lee | 6,197 | 10.5 | +1.2 | |
| Indépendant | Andy Parr | 2,973 | 5.0 | New | |
| UKIP | Helena Windsor | 2,227 | 3.8 | -13.3 | |
| Green | Benedict Southworth | 1,100 | 1.9 | -2.0 | |
| Majorité | 23,914 | 40.4 | N/A | ||
| Participation | 59,203 | 74.9 | +4.5 | ||
| Conservateur hold | Swing | -2.6 | |||
| Parti | Candidat | Votes | % | ± | |
|---|---|---|---|---|---|
| Conservateur | Sam Gyimah | 32,211 | 57.4 | +0.7 | |
| UKIP | Helena Windsor | 9,553 | 17.0 | +10.1 | |
| Travailliste | Matt Wilson | 6,627 | 11.8 | +2.8 | |
| Libéral Démocrate | David Lee | 5,189 | 9.2 | -16.6 | |
| Green | Nicola Dodgson | 2,159 | 3.8 | New | |
| Indépendant | Sandy Pratt | 364 | 0.6 | -0.1 | |
| Majorité | 22,658 | 40.4 | +0.5 | ||
| Participation | 56,103 | 70.4 | −0.7 | ||
| Conservateur hold | Swing | -4.7 | |||
| Parti | Candidat | Votes | % | ± | |
|---|---|---|---|---|---|
| Conservateur | Sam Gyimah | 31,007 | 56.7 | +0.6 | |
| Libéral Démocrate | David Lee | 14,133 | 25.9 | +2.0 | |
| Travailliste | Mathew Rodda | 4,925 | 9.0 | -5.8 | |
| UKIP | Helena Windsor | 3,770 | 6.9 | +2.5 | |
| Monster Raving Loony | Martin Hogbin | 422 | 0.8 | New | |
| Indépendant | Sandy Pratt | 383 | 0.7 | New | |
| Majorité | 16,874 | 30.9 | |||
| Participation | 54,640 | 71.1 | +4.5 | ||
| Conservateur hold | Swing | ||||
Élections dans les années 2000
| Parti | Candidat | Votes | % | ± | |
|---|---|---|---|---|---|
| Conservateur | Peter Ainsworth | 27,659 | 56.2 | +3.7 | |
| Libéral Démocrate | Jeremy Pursehouse | 11,738 | 23.8 | -0.6 | |
| Travailliste | James Bridge | 7,288 | 14.8 | -4.3 | |
| UKIP | Tony Stone | 2,158 | 4.4 | +0.5 | |
| Légalise Cannabis | Winston Matthews | 410 | 0.8 | +0.8 | |
| Majorité | 15,921 | 32.3 | |||
| Participation | 49,253 | 66.6 | +3.3 | ||
| Conservateur hold | Swing | +2.1 | |||
| Parti | Candidat | Votes | % | ± | |
|---|---|---|---|---|---|
| Conservateur | Peter Ainsworth | 24,706 | 52.5 | +2.4 | |
| Libéral Démocrate | Jeremy Pursehouse | 11,503 | 24.4 | +1.9 | |
| Travailliste | Jo Tanner | 8,994 | 19.1 | -2.1 | |
| UKIP | Tony Stone | 1,846 | 3.9 | +2.9 | |
| Majorité | 13,203 | 28.1 | |||
| Participation | 47,049 | 63.3 | -11.4 | ||
| Conservateur hold | Swing | ||||
Élections dans les années 1990
| Parti | Candidat | Votes | % | ± | |
|---|---|---|---|---|---|
| Conservateur | Peter Ainsworth | 27,389 | 50.1 | -10.9 | |
| Libéral Démocrate | Belinda Ford | 12,296 | 22.5 | -4.4 | |
| Travailliste | David Ross | 11,573 | 21.2 | +10.7 | |
| Référendum | Michael Sydney | 2,656 | 4.9 | ||
| UKIP | Tony Stone | 569 | 1.0 | ||
| Natural Law | Susan Bartrum | 173 | 0.3 | ||
| Majorité | 15,093 | 27.6 | |||
| Participation | 54,656 | 74.6 | |||
| Conservateur hold | Swing | ||||
Cette circonscription a subi des changements de limites entre les élections générales de 1992 et 1997 et, par conséquent, la variation des voix est basée sur un calcul théorique.
| Parti | Candidat | Votes | % | ± | |
|---|---|---|---|---|---|
| Conservateur | Peter Ainsworth | 29,767 | 62.3 | −1.1 | |
| Libéral Démocrate | Robert L. Tomlin | 12,111 | 25.4 | +1.4 | |
| Travailliste | Gill M. Roles | 5,075 | 10.6 | +0.2 | |
| Green | Ian T. Kilpatrick | 819 | 1.7 | −0.6 | |
| Majorité | 17,656 | 37.0 | −2.5 | ||
| Participation | 47,772 | 82.3 | +5.2 | ||
| Conservateur hold | Swing | −1.2 | |||
Élections dans les années 1980
| Parti | Candidat | Votes | % | ± | |
|---|---|---|---|---|---|
| Conservateur | Geoffrey Howe | 29,126 | 63.4 | +0.5 | |
| Liberal | Michael Anderson | 11,000 | 23.9 | −3.4 | |
| Travailliste | Michael Davis | 4,779 | 10.4 | +0.6 | |
| Green | David Newell | 1,044 | 2.3 | ||
| Majorité | 18,126 | 39.5 | |||
| Participation | 45,949 | 77.2 | |||
| Conservateur hold | Swing | ||||
| Parti | Candidat | Votes | % | ± | |
|---|---|---|---|---|---|
| Conservateur | Geoffrey Howe | 27,272 | 62.9 | ||
| Liberal | Susan Liddell | 11,836 | 27.3 | ||
| Travailliste | Hugh Pincott | 4,249 | 9.8 | ||
| Majorité | 15,436 | 35.6 | |||
| Participation | 43,357 | 74.1 | |||
| Conservateur hold | Swing | ||||
Élections dans les années 1970
| Parti | Candidat | Votes | % | ± | |
|---|---|---|---|---|---|
| Conservateur | Geoffrey Howe | 28,266 | 62.84 | ||
| Liberal | Susan Liddell | 8,866 | 19.71 | ||
| Travailliste | Graham Harries | 7,398 | 16.45 | ||
| National Front | D. Smith | 452 | 1.00 | ||
| Majorité | 19,400 | 43.13 | |||
| Participation | 78.42 | ||||
| Conservateur hold | Swing | ||||
| Parti | Candidat | Votes | % | ± | |
|---|---|---|---|---|---|
| Conservateur | Geoffrey Howe | 22,227 | 52.41 | ||
| Liberal | Kenneth Vaus | 12,382 | 29.20 | ||
| Travailliste | David Allonby | 7,797 | 18.39 | ||
| Majorité | 9,845 | 23.22 | |||
| Participation | 76.17 | ||||
| Conservateur hold | Swing | ||||
| Parti | Candidat | Votes | % | ± | |
|---|---|---|---|---|---|
| Conservateur | Geoffrey Howe | 23,563 | 51.16 | ||
| Liberal | Kenneth Vaus | 15,544 | 33.75 | ||
| Travailliste | David Allonby | 6,946 | 15.08 | ||
| Majorité | 8,019 | 17.41 | |||
| Participation | 83.58 | ||||
| Conservateur hold | Swing | ||||
| Parti | Candidat | Votes | % | ± | |
|---|---|---|---|---|---|
| Conservateur | William Clark | 35,773 | 61.99 | ||
| Liberal | Percy W. Meyer | 11,749 | 20.36 | ||
| Travailliste | Michael D. Simmons | 10,186 | 17.65 | ||
| Majorité | 24,024 | 41.63 | |||
| Participation | 73.08 | ||||
| Conservateur hold | Swing | ||||
Élections dans les années 1960
| Parti | Candidat | Votes | % | ± | |
|---|---|---|---|---|---|
| Conservateur | Charles Doughty | 30,900 | 54.54 | ||
| Liberal | Michael R Lane | 16,407 | 28.96 | ||
| Travailliste | Cyril Shaw | 9,347 | 16.50 | ||
| Majorité | 14,493 | 25.58 | |||
| Participation | 79.33 | ||||
| Conservateur hold | Swing | ||||
| Parti | Candidat | Votes | % | ± | |
|---|---|---|---|---|---|
| Conservateur | Charles Doughty | 31,827 | 55.94 | ||
| Liberal | Michael R Lane | 16,049 | 28.21 | ||
| Travailliste | James Stewart Cook | 9,020 | 15.85 | ||
| Majorité | 15,778 | 27.73 | |||
| Participation | 79.22 | ||||
| Conservateur hold | Swing | ||||
Élections dans les années 1950
| Parti | Candidat | Votes | % | ± | |
|---|---|---|---|---|---|
| Conservateur | Charles Doughty | 36,310 | 63.94 | ||
| Liberal | Kenneth Vaus | 10,376 | 18.27 | ||
| Travailliste | James C Hunt | 10,102 | 17.79 | ||
| Majorité | 25,934 | 45.67 | |||
| Participation | 81.13 | ||||
| Conservateur hold | Swing | ||||
| Parti | Candidat | Votes | % | ± | |
|---|---|---|---|---|---|
| Conservateur | Charles Doughty | 37,276 | 74.79 | ||
| Travailliste | Jean Graham Hall[27] | 12,567 | 25.21 | ||
| Majorité | 24,709 | 49.57 | |||
| Participation | 76.47 | ||||
| Conservateur hold | Swing | ||||
| Parti | Candidat | Votes | % | ± | |
|---|---|---|---|---|---|
| Conservateur | Charles Doughty | 37,966 | 72.98 | ||
| Travailliste | Nathan Whine | 14,056 | 27.02 | ||
| Majorité | 23,910 | 45.96 | |||
| Participation | 81.30 | ||||
| Conservateur hold | Swing | ||||
| Parti | Candidat | Votes | % | ± | |
|---|---|---|---|---|---|
| Conservateur | Michael Astor | 32,711 | 60.92 | ||
| Travailliste | Nathan Whine | 12,499 | 23.28 | ||
| Liberal | Wendy Wills | 8,484 | 15.80 | ||
| Majorité | 20,212 | 37.64 | |||
| Participation | 87.17 | ||||
| Conservateur hold | Swing | ||||
Élections dans les années 1940
| Parti | Candidat | Votes | % | ± | |
|---|---|---|---|---|---|
| Conservateur | Michael Astor | 31,117 | 53.36 | ||
| Travailliste | Henry Edward Weaver | 17,708 | 30.36 | ||
| Liberal | Donald Phillip Owen | 9,495 | 16.28 | ||
| Majorité | 13,409 | 22.99 | |||
| Participation | 74.50 | ||||
| Conservateur hold | Swing | ||||
Élections dans les années 1930
Élection générale 1939/40 :
Une autre élection générale devait avoir lieu avant la fin de 1940. Les partis politiques préparaient une élection à partir de 1939 et à la fin de cette année, les candidats suivants avaient été sélectionnés;
- Conservateur: Charles Emmott
- Travailliste:
| Parti | Candidat | Votes | % | ± | |
|---|---|---|---|---|---|
| Conservateur | Charles Emmott | 33,776 | 78.91 | ||
| Travailliste | Henry Edward Weaver | 9,025 | 21.09 | ||
| Majorité | 24,751 | 57.83 | |||
| Participation | 66.54 | ||||
| Conservateur hold | Swing | ||||
| Parti | Candidat | Votes | % | ± | |
|---|---|---|---|---|---|
| Conservateur | James Galbraith | 33,771 | 88.85 | ||
| Travailliste | Mont Follick | 4,236 | 11.15 | ||
| Majorité | 29,535 | 77.71 | |||
| Participation | 71.40 | ||||
| Conservateur hold | Swing | ||||
Élections dans les années 1920
| Parti | Candidat | Votes | % | ± | |
|---|---|---|---|---|---|
| Unioniste | James Galbraith | 19,578 | 60.9 | ||
| Liberal | Ida Swinburne | 7,435 | 23.1 | ||
| Travailliste | Robert Oscar Mennell | 5,152 | 16.0 | ||
| Majorité | 12,143 | 37.8 | |||
| Participation | |||||
| Unioniste hold | Swing | ||||
| Parti | Candidat | Votes | % | ± | |
|---|---|---|---|---|---|
| Unioniste | James Galbraith | 15,999 | 83.1 | n/a | |
| Travailliste | Robert Oscar Mennell | 3,249 | 16.9 | n/a | |
| Majorité | 12,750 | 66.2 | n/a | ||
| Participation | 70.7 | n/a | |||
| Unioniste hold | Swing | n/a | |||
| Parti | Candidat | Votes | % | ± | |
|---|---|---|---|---|---|
| Unioniste | James Galbraith | unopposed | n/a | n/a | |
| Unioniste hold | Swing | n/a | |||
| Parti | Candidat | Votes | % | ± | |
|---|---|---|---|---|---|
| Unioniste | James Galbraith | 12,498 | 77.3 | -5.5 | |
| Travailliste | Marjorie Pease | 3,667 | 22.7 | n/a | |
| Majorité | 8,831 | 54.6 | -11.0 | ||
| Participation | 64.5 | +17.4 | |||
| Unioniste hold | Swing | n/a | |||
Élections dans les années 1910
| Parti | Candidat | Votes | % | ± | |
|---|---|---|---|---|---|
| C | Unioniste | Stuart Coats | 8,795 | 82.8 | n/a |
| Liberal | Guy Hayler | 1,830 | 17.2 | n/a | |
| Majorité | 6,965 | 65.6 | n/a | ||
| Participation | 47.1 | n/a | |||
| Unioniste vainqueur (nouveau siège) | |||||
| C candidat approuvé par le gouvernement de coalition. | |||||
Résultats élection 1832-1885
Élections dans les années 1880
| Parti | Candidat | Votes | % | ± | |
|---|---|---|---|---|---|
| Conservateur | William Grantham | 8,104 | 28.9 | +0.4 | |
| Conservateur | James Watney | 8,006 | 28.6 | −0.4 | |
| Liberal | William F Robinson[30] | 5,978 | 21.3 | −0.6 | |
| Liberal | George Webb Medley[31] | 5,928 | 21.2 | +0.7 | |
| Majorité | 2,028 | 7.2 | +0.6 | ||
| Participation | 14,008 (est) | 73.8 (est) | +6.2 | ||
| Registre électeurs | 18,969 | ||||
| Conservateur hold | Swing | +0.5 | |||
| Conservateur hold | Swing | −0.6 | |||
Élections dans les années 1870
| Parti | Candidat | Votes | % | ± | |
|---|---|---|---|---|---|
| Conservateur | James Watney | 5,673 | 29.0 | +5.6 | |
| Conservateur | William Grantham | 5,579 | 28.5 | +5.6 | |
| Liberal | Peter King | 4,292 | 21.9 | −5.7 | |
| Liberal | John Peter Gassiot | 4,015 | 20.5 | −5.6 | |
| Majorité | 1,287 | 6.6 | N/A | ||
| Participation | 9,780 (est) | 67.6 (est) | −1.5 | ||
| Registre électeurs | 14,468 | ||||
| Conservateur vainqueur sur Liberal | Swing | +5.6 | |||
| Conservateur vainqueur sur Liberal | Swing | +5.6 | |||
| Parti | Candidat | Votes | % | ± | |
|---|---|---|---|---|---|
| Conservateur | James Watney | 3,912 | 58.7 | +12.4 | |
| Liberal | Granville Leveson-Gower[32] | 2,749 | 41.3 | −12.4 | |
| Majorité | 1,163 | 17.5 | N/A | ||
| Participation | 6,661 | 51.4 | −17.7 | ||
| Registre électeurs | 12,960 | ||||
| Conservateur vainqueur sur Liberal | Swing | +12.4 | |||
- Causé par la mort de Buxton.
Élections dans les années 1860
| Parti | Candidat | Votes | % | ± | |
|---|---|---|---|---|---|
| Liberal | Peter King | 4,162 | 27.6 | +1.7 | |
| Liberal | Charles Buxton | 3,941 | 26.1 | +0.7 | |
| Conservateur | William Hardman[33] | 3,537 | 23.4 | −1.3 | |
| Conservateur | James Lord[34] | 3,459 | 22.9 | −1.0 | |
| Majorité | 404 | 2.7 | +2.0 | ||
| Participation | 7,550 (est) | 69.1 (est) | +1.1 | ||
| Registre électeurs | 10,932 | ||||
| Liberal hold | Swing | +1.4 | |||
| Liberal hold | Swing | +0.9 | |||
| Parti | Candidat | Votes | % | ± | |
|---|---|---|---|---|---|
| Liberal | Peter King | 3,495 | 25.9 | −11.0 | |
| Liberal | Charles Buxton | 3,424 | 25.4 | −11.8 | |
| Conservateur | Henry Peek | 3,333 | 24.7 | +11.7 | |
| Conservateur | William Brodrick | 3,226 | 23.9 | +10.9 | |
| Majorité | 91 | 0.7 | −10.3 | ||
| Participation | 6,739 (est) | 68.0 (est) | +0.1 | ||
| Registre électeurs | 9,913 | ||||
| Liberal hold | Swing | −11.2 | |||
| Liberal hold | Swing | −11.6 | |||
Élections dans les années 1850
| Parti | Candidat | Votes | % | ± | |
|---|---|---|---|---|---|
| Liberal | Thomas Alcock | 2,953 | 37.2 | N/A | |
| Liberal | Peter King | 2,926 | 36.9 | N/A | |
| Conservateur | Anthony Cleasby | 2,050 | 25.9 | N/A | |
| Majorité | 876 | 11.0 | N/A | ||
| Participation | 4,990 (est) | 67.9 (est) | N/A | ||
| Registre électeurs | 7,350 | ||||
| Liberal hold | Swing | N/A | |||
| Liberal hold | Swing | N/A | |||
| Parti | Candidat | Votes | % | ± | |
|---|---|---|---|---|---|
| Whig | Thomas Alcock | Sans opposition | |||
| Whig | Peter King | Sans opposition | |||
| Registre électeurs | 7,191 | ||||
| Whig hold | |||||
| Whig hold | |||||
| Parti | Candidat | Votes | % | ± | |
|---|---|---|---|---|---|
| Whig | Thomas Alcock | 2,508 | 27.9 | N/A | |
| Whig | Peter King | 2,500 | 27.8 | N/A | |
| Conservateur | Edmund Antrobus | 2,064 | 22.9 | N/A | |
| Conservateur | Anthony Cleasby | 1,928 | 21.4 | N/A | |
| Majorité | 436 | 4.8 | N/A | ||
| Participation | 4,500 (est) | 68.0 (est) | N/A | ||
| Registre électeurs | 6,618 | ||||
| Whig hold | Swing | N/A | |||
| Whig hold | Swing | N/A | |||
Élections dans les années 1840
| Parti | Candidat | Votes | % | ± | |
|---|---|---|---|---|---|
| Whig | Thomas Alcock | Sans opposition | |||
| Whig | Peter King | Sans opposition | |||
| Registre électeurs | 6,028 | ||||
| Whig Vainqueur de Conservateur | |||||
| Whig Vainqueur de Conservateur | |||||
| Parti | Candidat | Votes | % | ± | |
|---|---|---|---|---|---|
| Conservateur | Edmund Antrobus | Sans opposition | |||
| Conservateur | Henry Kemble | Sans opposition | |||
| Registre électeurs | 6,222 | ||||
| Conservateur hold | |||||
| Conservateur hold | |||||
| Parti | Candidat | Votes | % | ± | |
|---|---|---|---|---|---|
| Conservateur | Edmund Antrobus | 2,635 | 64.7 | +10.7 | |
| Whig | Thomas Alcock | 1,436 | 35.3 | −10.7 | |
| Majorité | 1,199 | 29.5 | +25.9 | ||
| Participation | 4,071 | 65.4 | −5.8 | ||
| Registre électeurs | 6,222 | ||||
| Conservateur hold | Swing | +10.7 | |||
- Causé par la mort d'Alsager.
Élections dans les années 1830
| Parti | Candidat | Votes | % | ± | |
|---|---|---|---|---|---|
| Conservateur | Richard Alsager | 2,176 | 27.1 | +7.9 | |
| Conservateur | Henry Kemble | 2,155 | 26.9 | +7.7 | |
| Whig | Peter King | 1,865 | 23.3 | +8.7 | |
| Whig | John Angerstein | 1,823 | 22.7 | +8.1 | |
| Majorité | 290 | 3.6 | −2.6 | ||
| Participation | 3,937 | 71.2 | −6.6 | ||
| Registre électeurs | 5,531 | ||||
| Conservateur hold | Swing | −0.3 | |||
| Conservateur vainqueur sur Radical | Swing | −0.4 | |||
| Parti | Candidat | Votes | % | ± | |
|---|---|---|---|---|---|
| Conservateur | Richard Alsager | 1,578 | 38.5 | +17.0 | |
| Radical | Aubrey Beauclerk | 1,324 | 32.3 | +2.5 | |
| Whig | John Ivatt Briscoe | 1,200 | 29.3 | −19.4 | |
| Participation | 2,753 | 77.8 | +7.6 | ||
| Registre électeurs | 3,537 | ||||
| Majorité | 254 | 6.2 | N/A | ||
| Conservateur vainqueur sur Whig | Swing | +13.4 | |||
| Majorité | 124 | 3.0 | −5.3 | ||
| Radical hold | Swing | +6.1 | |||
| Parti | Candidat | Votes | % | ||
|---|---|---|---|---|---|
| Whig | John Ivatt Briscoe | 1,643 | 42.4 | ||
| Radical | Aubrey Beauclerk | 1,155 | 29.8 | ||
| Tory | Thomas Jeffreys Allen[35] | 835 | 21.5 | ||
| Whig | John Lainson | 244 | 6.3 | ||
| Participation | 2,211 | 70.2 | |||
| Registre électeurs | 3,150 | ||||
| Majorité | 488 | 12.6 | |||
| Whig vainqueur (nouveau siège) | |||||
| Majorité | 320 | 8.3 | |||
| Radical vainqueur (nouveau siège) | |||||
Références
- (en) Cet article est partiellement ou en totalité issu de l’article de Wikipédia en anglais intitulé « East Surrey (UK Parliament constituency) » (voir la liste des auteurs).
- Leigh Rayment's Historical List of MPs – Constituencies beginning with "S" (part 6)
- F. W. S. Craig, British parliamentary election results 1832–1885, Chichester, Parliamentary Research Services, , 2nd éd. (1re éd. 1977), 465–466 p. (ISBN 0-900178-26-4)
- Henry Stooks Smith, The Parliaments of England, from 1st George I., to the Present Time. Vol II: Oxfordshire to Wales Inclusive, London, Simpkin, Marshall, & Co., (lire en ligne), p. 65
- Edward Churton, The Assembled Commons or Parliamentary Biographer: 1838, (lire en ligne), p. 38
- « John Ivatt Briscoe », sur Legacies of British Slave-ownership, University College London (consulté le )
- « Pamphlet: A Letter on the Nature and Effects of the Tread-Wheel », sur British Library (consulté le )
- A Member of the Middle Temple, The Assembled Commons or Parliamentary Biographer: With An Abstract of the Law of Election, and the Usages of Parliament, London, Scott, Webster, and Geary, , 38, 70 p. (lire en ligne)
- Labour and Radical Politics: 1762–1937, Abingdon, Routledge, (ISBN 978-0-415-26570-6, lire en ligne), p. 47
- Flann Campbell, « The Elusive Mr Ogilvie », Ulster Historical Foundation, vol. 2, no 9, , p. 42 (ISBN 0-901905-61-5, lire en ligne, consulté le )
- Edward Churton, The Assembled Commons or Parliamentary Biographer: 1836, (lire en ligne), p. 16
- « The General Election », Morning Post, , p. 3 (lire en ligne
 , consulté le )
 - « Bell's Weekly Messenger » , (consulté le ), p. 5
- Leigh Rayment's Historical List of MPs – Constituencies beginning with "A" (part 1)
- Major boundary changes to the constituency took place for this election
- https://www.tandridge.gov.uk/Portals/0/Documents/Your-council/Voting-and-elections/Current%20elections/General%20Election/Statement-of-Persons-Nominated-and-notice-of-poll.pdf?ver=2019-11-14-160145-033
- « Surrey East parliamentary constituency – Election 2017 », BBC News, (lire en ligne, consulté le )
- « Election Data 2015 » [archive du ], Electoral Calculus (consulté le )
- « Surrey East parliamentary constituency – Election 2017 »
- « Election Data 2010 » [archive du ], Electoral Calculus (consulté le )
- « Election Data 2005 » [archive du ], Electoral Calculus (consulté le )
- « Election Data 2001 » [archive du ], Electoral Calculus (consulté le )
- « Election Data 1997 » [archive du ], Electoral Calculus (consulté le )
- « Election Data 1992 » [archive du ], Electoral Calculus (consulté le )
- « Politics Resources » [archive du ], sur Election 1992, Politics Resources, (consulté le )
- « Election Data 1987 » [archive du ], Electoral Calculus (consulté le )
- « Election Data 1983 » [archive du ], Electoral Calculus (consulté le )
- HALL, Her Honour Jean Graham’, Who Was Who, A & C Black, an imprint of Bloomsbury Publishing plc, 1920–2016; online edn, Oxford University Press, 2014 ; (en) « http://www.ukwhoswho.com/view/article/oupww/whowaswho/U18635 »(Archive • Wikiwix • Archive.is • Google • Que faire ?), (consulté le ).
- British Parliamentary Election Results 1918–1949, FWS Craig
- British Parliamentary Election Results 1832–1885, London, Macmillan Press, , 1st éd., e-book (ISBN 978-1-349-02349-3), p. 466
- « To The Electors of East Surrey », Croydon Guardian and Surrey County Gazette, , p. 4 (lire en ligne, consulté le )
- « MEDLEY AND WEBB IMAGES AND BIOGRAPHICAL NOTES 3 », sur Jamaican Family Search (consulté le )
- « East Surrey Election », Huddersfield Chronicle, , p. 3 (lire en ligne , consulté le )
- « Surrey Election », London Evening Standard, , p. 1 (lire en ligne , consulté le )
- « Surrey Election », Hampshire Advertiser, , p. 10–11 (lire en ligne , consulté le )
- « Election Proceedings », Globe, , p. 4 (lire en ligne , consulté le )
Sources
- Résultats élections, 2010 BBC News
- Résultats élections, 2005 BBC News
- Résultats élections, 1997 – 2001 BBC News
- Résultats élections, 1997 – 2001 Election Demon
- Résultats élections, 1983 – 1992 Election Demon
- Résultats élections, 1992 – 2010 The Guardian
- Résultats élections, 1945 – 1979 Politics Resources
Articles connexes
 Portail de la politique britannique